Every year, Google invites open source projects from various organizations so that students across the globe can contribute to them as a part of Google Summer of Code program. I was fortunate enough to be a part of GSoC-16 under the organization Oppia. Before I go on and detail my journey, let me tell you something about myself: I am Avijit Gupta, a Computer Science undergraduate who loves to contribute to Open Source. I primarily like to work on Frontend related technologies.
My journey with Oppia began as a contributor within the first few days after the announcement of selected organizations in GSoC this year.
About the Project
Oppia is a community of learners and teachers to help anyone learn anything they want in an effective and enjoyable way. Being a community based on education, it’s absolutely important that the quality of content is not compromised at any cost. Content being the primary focus leads us all to believe that content creators play a pivotal role in the learning pipeline. The learning experience can be better enhanced with improvements in the so-called “explorations” (lessons) created. To accomplish this, the creator must be made aware of the current state of his/her exploration(s), so that each step forward is towards the improvement of the quality of content.
The project “Creator Dashboard” aimed at implementing a dashboard that allows lesson creators to see common statistics like total plays, average rating, common student misconceptions, and student-submitted feedback for the lessons they own – and to make it easy for creators to take action on this information.
Revamping the existing “Creator Dashboard” aimed at implementing a dashboard with the following goals:
Allow lesson creators to see common statistics like total plays, average rating, common student misconceptions, and student-submitted feedback for the lessons they own – and to make it easy for creators to take action on this information.
Prioritize the explorations in the dashboard which need action, decided on the basis of different parameters like number of new feedback and number of unresolved answers.
Final Work
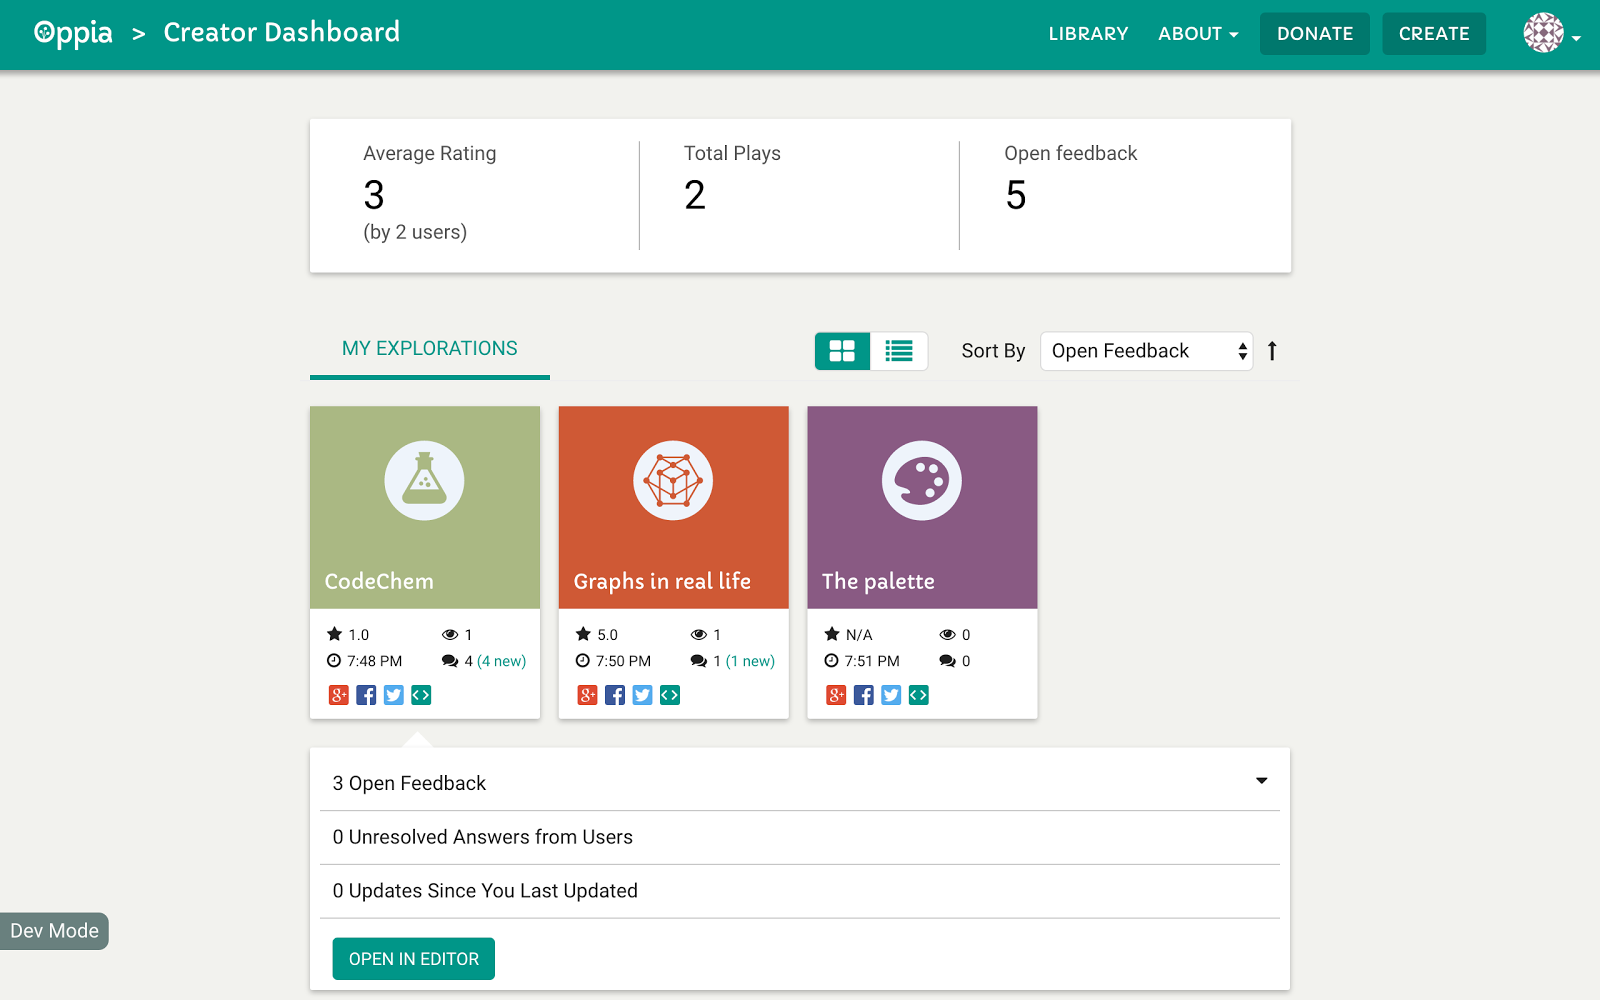
The new dashboard page allows creators to view their explorations in either the default view as shown above (card view) or in a tabular format (list view). Users can switch to the list view to see a more informative version of the dashboard.
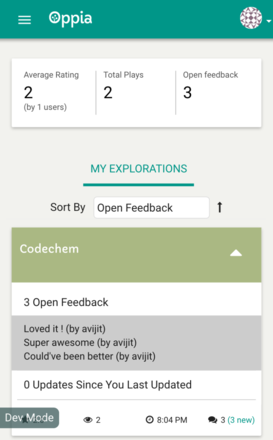
The statistics shown in the top white row are values calculated across all the explorations of a user. In the default card view, explorations may be clicked on to open up a dropdown which provides statistics for that exploration. However, if the exploration is private then the user will be taken directly to the editor. The explorations can be sorted using the select dropdown and even by clicking on the table headers in the list view. In order to ease the process of popularizing the content created, there are options in the dashboard to share explorations on popular social media platforms like Google+, Facebook, and Twitter. Lastly, to provide an equally appealing experience for the users browsing the dashboard through mobile devices, care was taken to ensure the new dashboard be almost as well equipped as it’s desktop version. Here’s how it looks on smaller screens:
Weekly progress logs
Week #1
- Started off work by creating a continuous map-reduce job which will actually calculate the statistics.
- Changes in existing data models to store the computed data.
Week #2
- Write unit tests and integration tests for the map-reduce job.
- Pull Request: https://github.com/oppia/oppia/pull/1891
Week #3
- Write a backend service to fetch data from models and send it to the controllers, along with unit tests.
- Pull Request: https://github.com/oppia/oppia/pull/2082
Week #4
- Implement controller on backend which fetches the data through the service, and sends it to the frontend as a JSON response.
- Improve on the existing code to make it less redundant and use
get_multidatastore calls as an optimization. - Pull Requests: https://github.com/oppia/oppia/pull/2096, https://github.com/oppia/oppia/pull/2101
Week #5
- Work on creating a service on frontend and the changes in controller.
- Testing both the service and controller.
- Make changes to the existing view of dashboard according to the latest mocks to mark the completion of MVP.
- Pull Requests: https://github.com/oppia/oppia/pull/2126, https://github.com/oppia/oppia/pull/2151
Week #6
- Additions to frontend view of dashboard in form of creating the card view for the dashboard.
- Pull Requests: https://github.com/oppia/oppia/pull/2155, https://github.com/oppia/oppia/pull/2170
Week #7
- Write a cron job to keep history of stats being recorded for each user. This kicks off a one-off map-reduce job to perform actual calculations.
- Tests for both cron job and one-off job.
- Pull Request: https://github.com/oppia/oppia/pull/2173
Week #8
- Fetch and display open feedback in dashboard - frontend and backend changes along with tests.
- Pull Request: https://github.com/oppia/oppia/pull/2239
Week #9
- Add realtime layer to statistics continuous job (written in the beginning) along with tests.
- Pull Request: https://github.com/oppia/oppia/pull/2238
Week #10
- Calculate and display change in statistics relative to the previous week’s data.
- Display new feedback on frontend separately.
- Pull Requests: https://github.com/oppia/oppia/pull/2252, https://github.com/oppia/oppia/pull/2281
Week #11
- Make creator dashboard UI responsive, so that it looks equally good on mobile devices as on desktops.
- Pull Request: https://github.com/oppia/oppia/pull/2291
Week #12
- (Marked as busy)
Week #13
- Work on adding sorting functionality to the list of explorations according to all the available parameters which are visible to the user, along with tests.
- Implement a dropdown which appears on clicking on each non-private exploration and displays most important statistical data to the user at once (PR for this is still not merged, due to a few failing tests!)
- Pull Requests: https://github.com/oppia/oppia/pull/2296, https://github.com/oppia/oppia/pull/2318
Future of the Project
- Write end-to-end tests for the creator dashboard (issue #2403).
- Add support for pagination of content in dashboard (was partially implemented in pull request #2265 before deciding to discontinue it for the time being).
- Collect and display statistics for collections as well, and not just individual explorations.
Conclusions
To conclude, I would like to thank Google for enabling students to participate in open source development through GSoC, the whole of Oppia community for accepting my project proposal and letting me embark on this fantastic adventure, and most importantly my mentors - Sean Lip, Xinyu Wu and Allan Zhou for being there to help me.
Well, during this 3 months of GSoC, I learn a lot. I did the best that I could do with my knowledge and help from the community. And though I can say that most of my work is concluded, there’s still a PR left unmerged, a few ongoing PRs involving work unrelated to GSoC and some more code I’ve promised to write. And I’m happy to do that!
Useful Links
All commits to Oppia: https://github.com/oppia/oppia/commits/develop?author=526avijitgupta
GSoC Project: https://summerofcode.withgoogle.com/projects/#5419488019218432
Accepted proposal: https://github.com/oppia/oppia/wiki/pdfs/GSoC2016AvijitGupta.pdf
Daily devlogs of work: https://docs.google.com/document/d/10EwtZYIUAuPhmRXzuN6JLEAexdTH0m1g-6Knqf35GQg/edit?usp=sharing